Skip to content
Designed for the Visual Investor
- Live Streaming Data
- Standard and Customizable Time Frames (1min, 5min, 10min, daily, weekly, monthly etc.)
- Customizable Range Bar (each bar moves certain number of tics before new bar is generated)
- Real-time Monthly and Weekly Options Data
- Commodity Spreads Trading Capabilities
- On-Chart Drag ‘n Drop Order Placement
- Live DOM (Depth of Market) Trading
- Fast Order Execution Buttons
- Market Entry, Exit, And OCO (One Cancels Other) Orders With A Single Mouse Click
- Simple Charts, Yet Powerful Graphical User Interface
Fibonacci & Elliott Wave Gann & Andrews Pitchfork
- Includes Fibonacci Tools like Time Zones, Fans, Arcs, Extensions and Retracements
- Identify Crucial Elliot Wave Patterns Manually and Automatically
- Measure Market Movements with Gann Fans and Andrews Pitchfork
- Educational Videos that help you to learn how to utilize these amazing tools
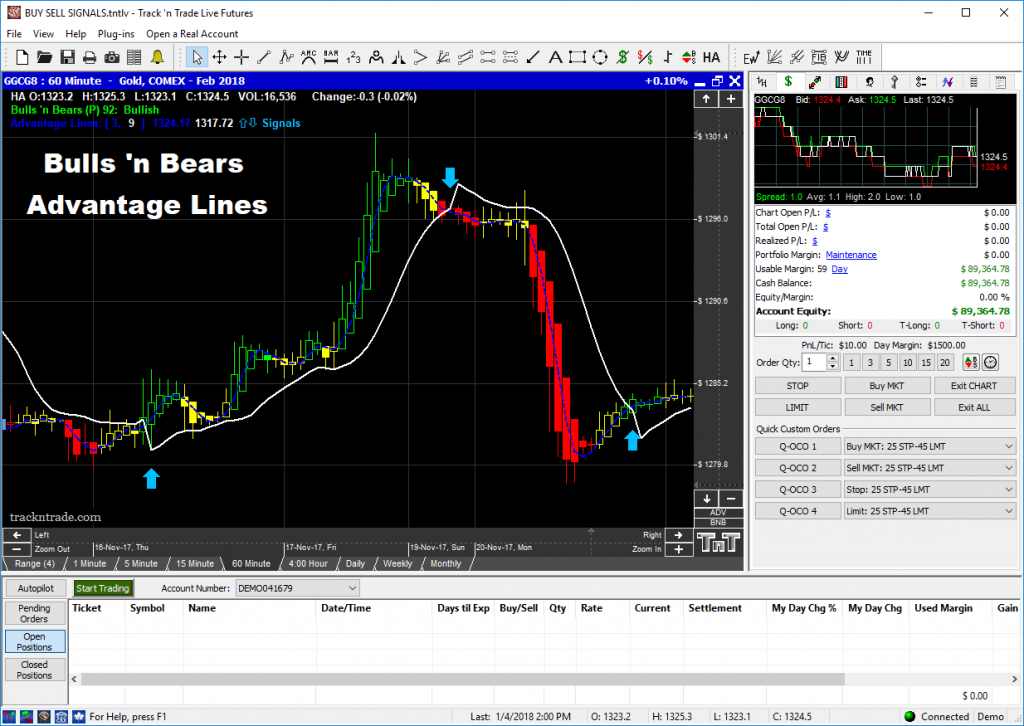
User-Definable Buy and Sell Signals
- User-Definable Up Arrows Indicate Buy, Down Arrows Indicate Sell, Simple As That
- Easily Customizable Settings For All Your Favorite Indicators
Easy-to-Use Charting and Notation Tools
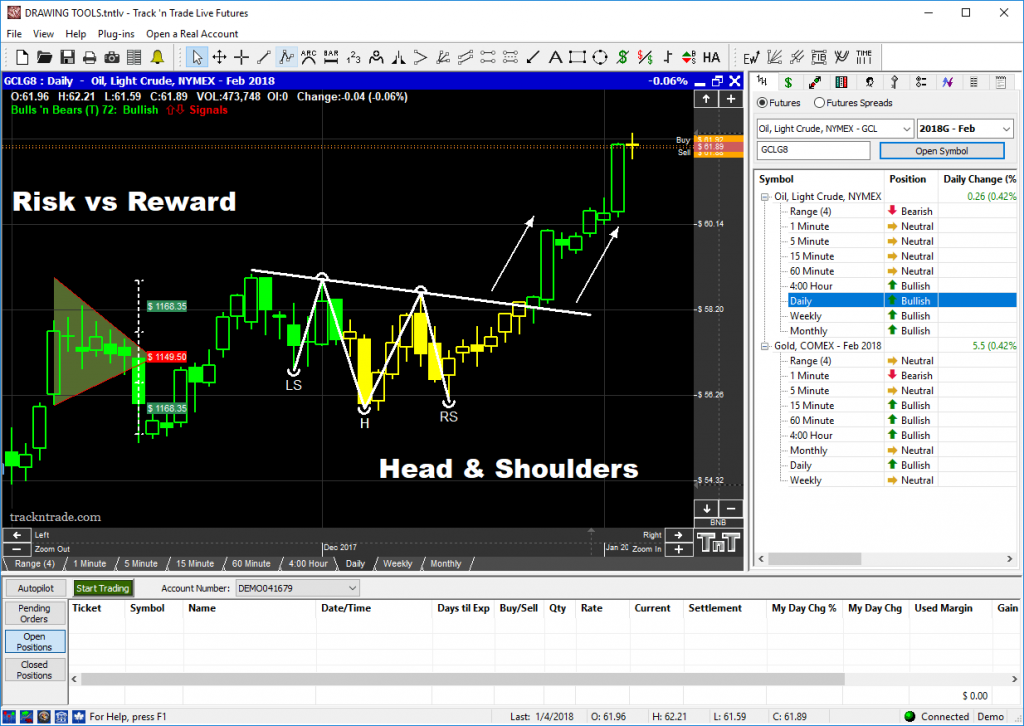
- Easily Draw Trend Lines, Trend Channels and Wedges
- Keep Notes on Your Chart With a Simple Text Tool
- 123 Tool, Head & Shoulders Tool, Multi-Line Tool, and More…
LIVE Options Trading
- Trade Options in your real money or demo account
- Drag ‘n Drop order placements
- Theoretical Value calculated using the Black & Scholes valuation Model
- Multiple options on multiple commodities at the same time
- Real-Time streaming options data
- Learn More about Options
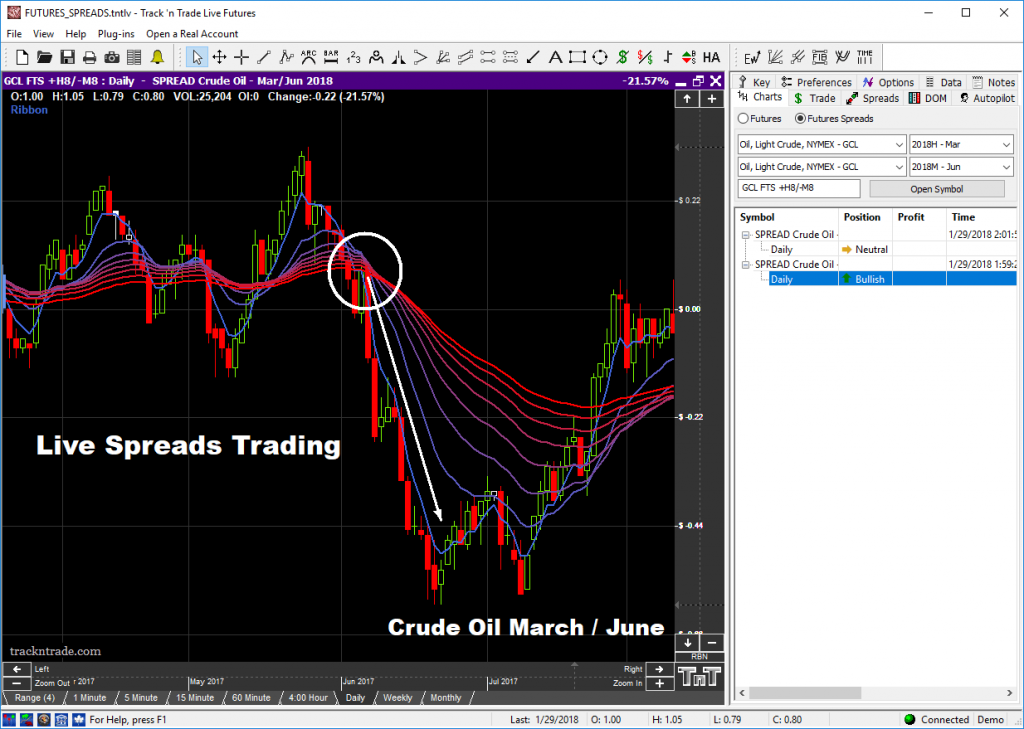
Trade Live Spreads Contracts
- Intra-Market – Calendar Spreads
- Inter-Market Spreads – Commodity Spreads
- Inter-Exchanges Spreads


